We have been using Elixir as our weapon of choice to develop resilient backend services for almost 2 years already, and we have never experienced downtime. But a few days ago one of our Elixir based server “went down”.
For us this came as a big surprise, and worse than that, because the servers had never crashed before we did not have the experience of debugging such a problem.
Sooner or later you might end up in the same situation as we did, so we decided to compile a list of resources and tools you can use to debug your problem.
Erlang crash dump file
The erl_crash.dump file should be the first stop you should take when investigating a crash. This file is located in the directory you deployed your app, in our case the file could be found inside the folder /opt/project_name/api/project_name inside the aws server.
You can use the command ls -la inside the directory to check if the modification date of the crash log matches the date of the downtime. If yes you are on the right path and you should check for the contents of the file.
The contents of the file can look very cryptic at first sight, but as usual the Erlang documentation is quite thorough and helps you go through it and understand every bit.
Crash dump viewer
If you are like us and you have a hard time skimming through textual information, Erlang has got you covered with the Crashdump viewer.
The Crashdump Viewer is a WxWidgets based tool for browsing Erlang crashdumps.
You can simply open a iex session on your terminal and then type :crashdump_viewer.start , you will then be prompted to select the crashlog you would like to open.
 How to start the crashdump viewer from your command line
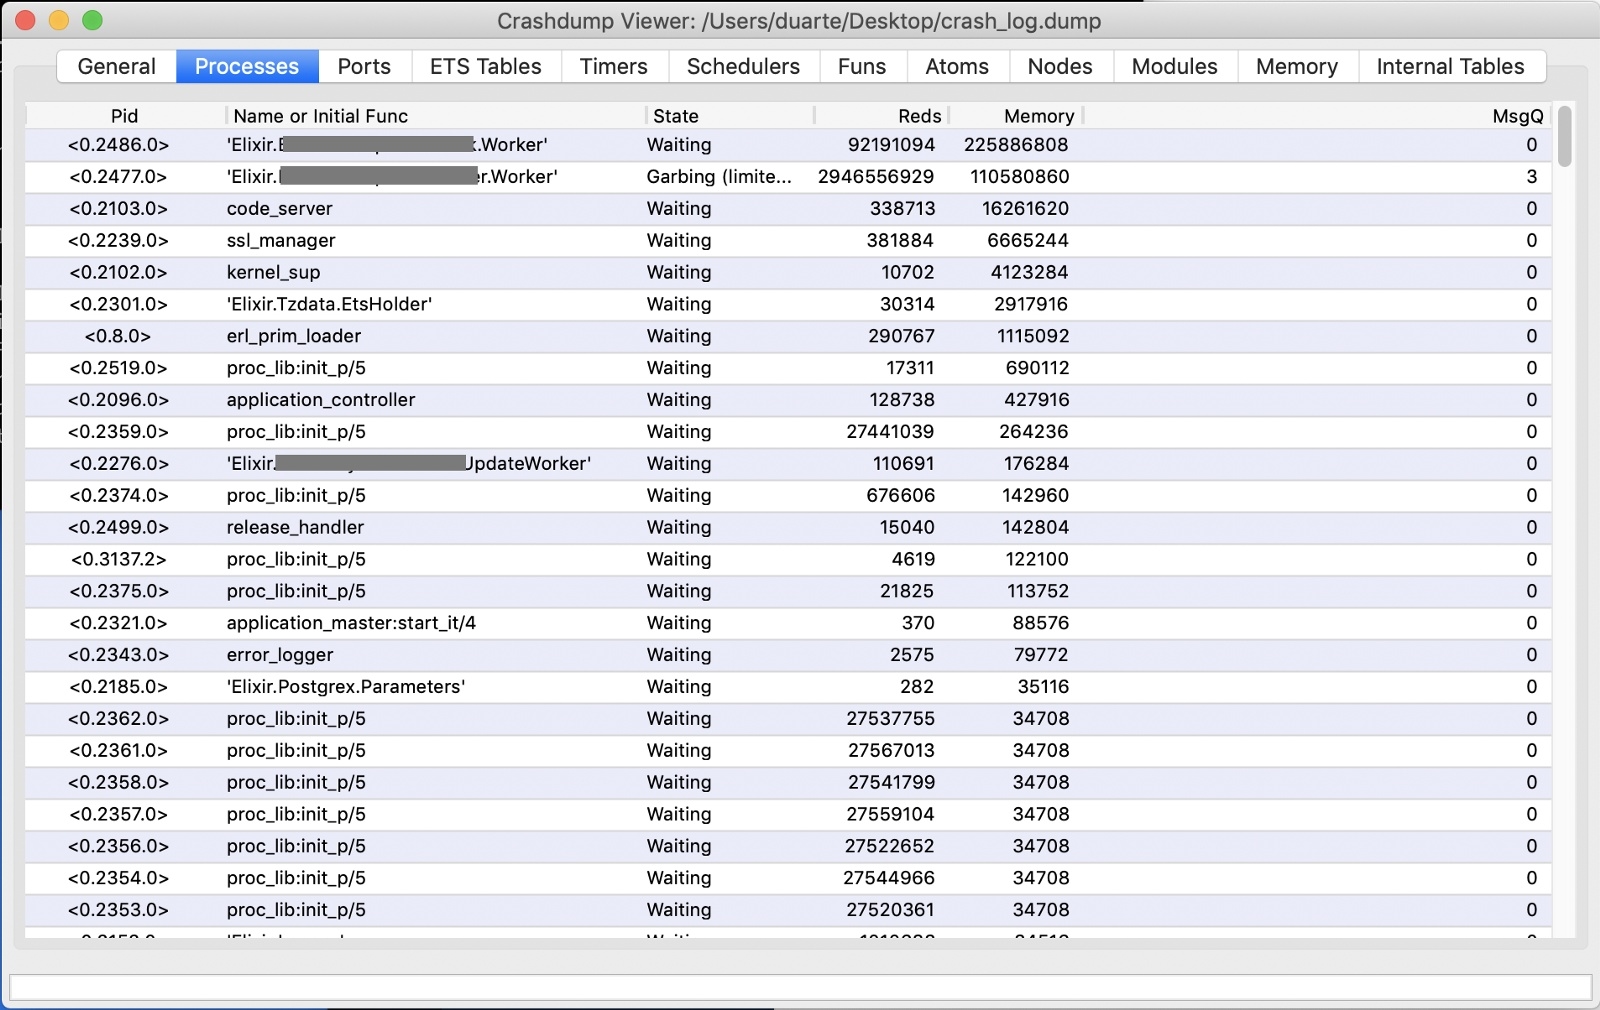
In the image bellow you can see the crashdump viewer in action. With it you can basically see what was going on (processes, memory, message queue, ETS tables …) at the exact time of the crash. The information contained should help you identify most of the problems that result in a crash.
 Crashdump viewer in action
Other useful links
Stuff Goes Bad: Erlang in Anger from Fred Hebert is a free ebook that contains a collection of tips and tricks to help understand where failures come from, code snippets and practices that helped developers debug production systems. It contains a full chapter on how to read crash logs.
Bruce Pomeroy has a great article that focus on a possible problem you can and should check for on your crash log, which is your server ran out of memory. This problem can be hard to identify and fix as it is not a direct result of an exception or some unhandled or unexpected return from a function.
Adopting Elixir From Concept to Production by Ben Marx, José Valim and Bruce Tate is also a great book that covers, among other topics, monitoring and debugging strategies and tools for Elixir based projects.


